A peek inside.
Let's start with a little insight into my mind.
And now let's see what kind of input those neurons have had to endure.
Medical data visualization.
Being trained in medical image processing, a lot of hours have been put into reading, processing, and clearly displaying medical image data. The graphical user interface shown below is a project I worked on over 11 years ago. It was written in Matlab, and it computes temperature maps from MRI scanner data.
The experiment below is a very first step towards heating (and thus killing) tumorous tissue in patients: a gel phantom is being heated by a laser fiber, and this is monitored by MRI temperature mapping.
Measuring temperature over time with an MRI scanner.
Computer Simulations.
MRI scanners are giant, very strong magnets. A large part of my research work therefore consisted of conducting computer simulations of magnetic field disctributions in various tissues.
The following simulation was done in 2010 to study the potential errors in MRI-based temperature maps during thermal ablation of breast tumors. With thermal ablation, tumorous tissue is detroyed by heating it. This heating can be done in various ways, with RF, using laser fibers, or with High Intensity Focussed Ultrasound. When you heat up breast tissue, its magnetic properties change. This leads to changes in the MRI measurement that may impact MRI-based temperature maps, leading to temperature errors. The following images display the result of this simulation, showing that errors indeed occurred.
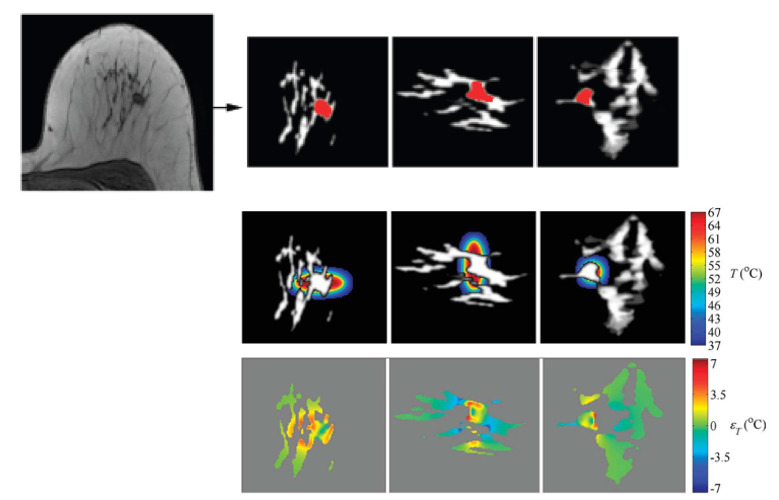
Simulation of errors in MR thermometry during thermal therapy of breast cancer
Another example: properties of water diffusion can be measured with MRI scanners. One diffusion-based MRI application that I worked on was measuring bone quality. The pore spaces of trabecular bone contain water, and the diffusion of this water depends on the pore size. Since pore size is a measure for bone quality, diffusion in these pores is an indirect measure for bone quality. Simulations of the effect of trabecular bone micro-architecture on the MRI signal were done to support this theory.
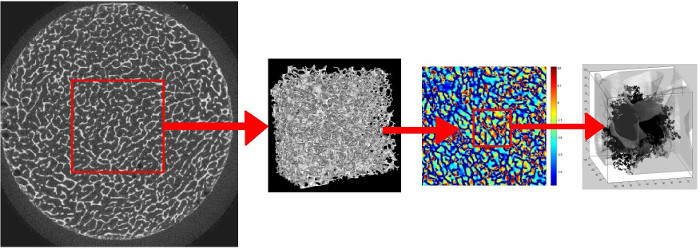
Simulation of water diffusion in pores of trabecular bone
Thesis.
The MRI research was written up in a thesis. You can download it by clicking on the cover below:

Sara Maria Sprinkhuizen - 2010
To download: click on image or here
Data visualization.
Over the summer of 2016, it became very clear that I wanted to take a deep dive into data visualization. Ever since, quite some things have been done, written, created, and read - hours of online courses, more online courses, visualizations of data, listening to podcasts, measurement of health status of a group of people who changed their eating pattern, random walk simulations, reading books, meeting people and even a hackathon.
The results of that adventure are shown in output.